Today I discovered yet another feature of Chrome’s awesome developer tools. They have some really great profiling tools for JavaScript.
The Mission
Find out why this page is lagging sometimes.
The Strategy
At first I shuddered when I ended up with this performance story on my list, because I’m used to trying to profile and pinpoint performance problems in Ruby, which can be… not so great. I started looking around for tools to check out the performance of JavaScript, and it turns out Chrome has all this great tooling built in!
Just open up the developer tools and go to the “Performance” tab, then click record and start doing the thing that makes your page slow.
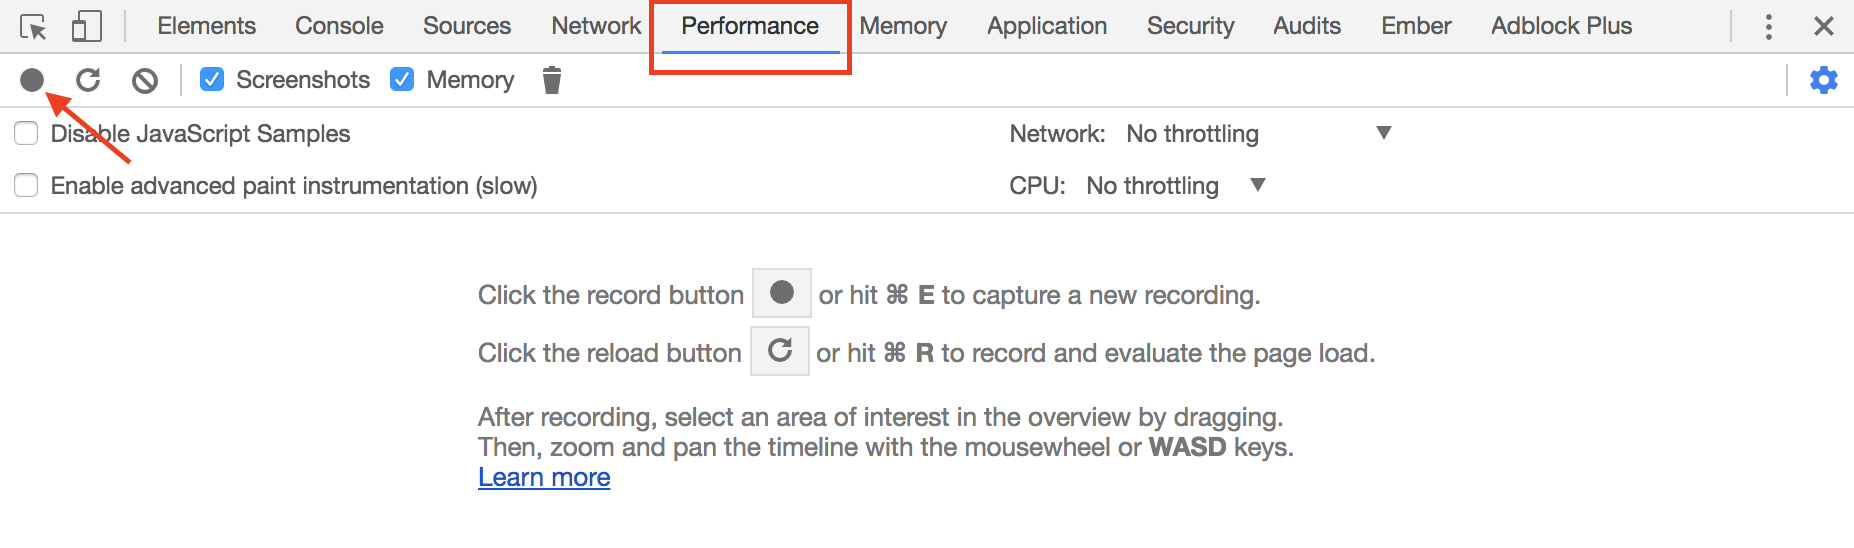
Chrome's awesome developer tools
Then check out this super-detailed profile with all the information you could ever need. To find the performance problem, look at the long boxes. Click on one, then click on the link to the source that Chrome will show to you, then voila! You know exactly what line of JavaScript is making your page slow, after like 2 minutes of performance testing. No extra libraries or code necessary. What a difference good tooling makes.
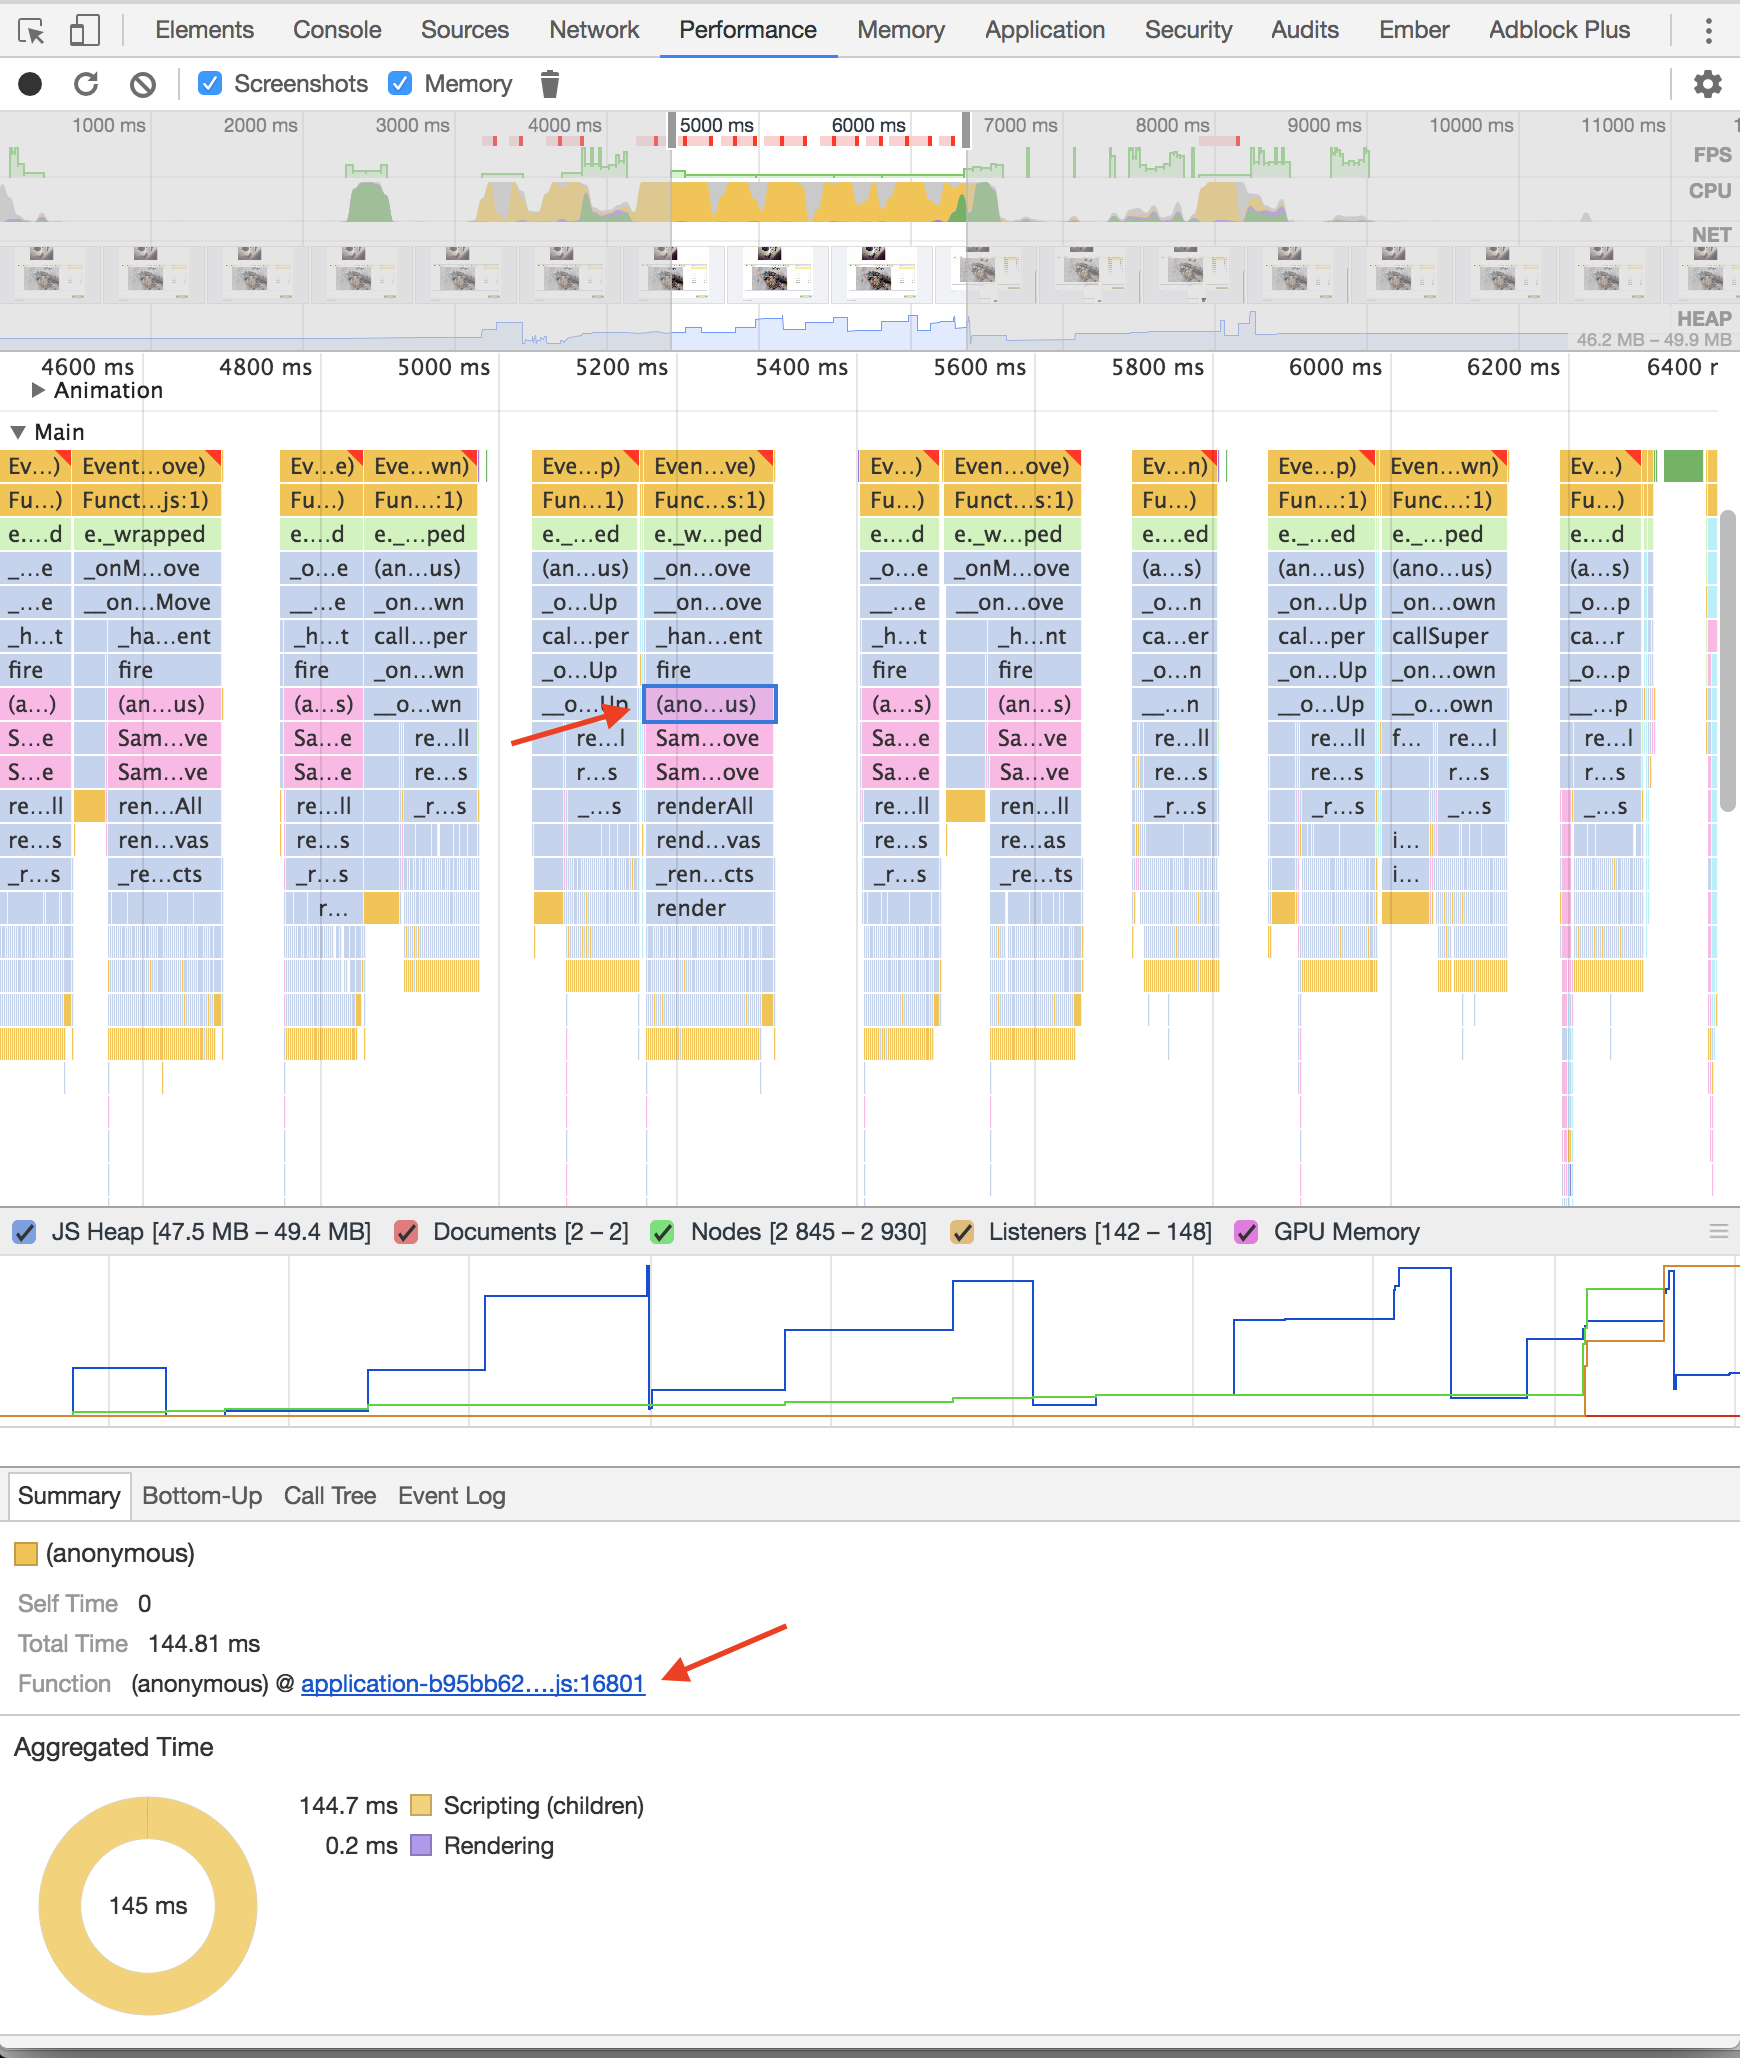
So easy to pinpoint performance problems in JavaScript now!
🙂